


13
TRACKER 5100/5100i/5500/5500i Installation and Operation Manual
NAVMAN
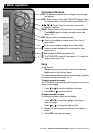
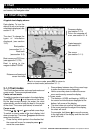
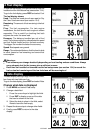
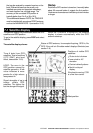
3-1-2 Latitude and longitude
Latitude and longitude can be displayed at the top of
the chart. Normally the position is the boat’s position,
and the latitude has a boat symbol to show this:
If the cursor has been moved in the last ten seconds,
then the position is the cursor’s position, and the
latitude has a cursor symbol to show this:
Warning: When reading the boat position,
make sure the position is not the cursor position.
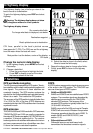
3-1-3 Chart scale
Press to zoom in and display a smaller area of
the chart in more detail. Press to zoom out and
display a bigger area in less detail.
The chart scale can be displayed (e.g. scale = 8 nm,
see below). The scale is the vertical distance across
the currently visible chart area. For example if the
scale is 8 nm then a portion of chart eight nautical
miles high is currently displayed.
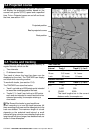
3-1-4 The compass
A compass can be displayed at the top of the chart
(see section 3-1-8).
When the boat is navigating to a point, the compass
shows the bearing to the destination (BRG) in the
middle and the boat’s course over ground (COG),
for example here BRG is 4° and COG is 12°:
Otherwise the compass shows the boat’s COG in
the middle, for example here COG is 12°:
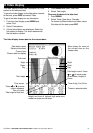
3-1-5 Chart symbols
The chart will show symbols, such as waypoints and
chart symbols. When the cursor is placed over a
symbol for at least two seconds, a data window
appears at the bottom left of the display with
information about the symbol.
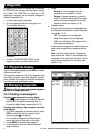
3-1-6 Chart information
To see stored data about a point on the chart (for
example, a chart symbol):
1 Move the cursor to that point on the chart.
2 Press MENU and select Chart info.
3 A menu of objects is displayed:
i Select an object to display.
ii Press ESC to return to the menu. Select
other objects.
iii Finally, press ESC to return to the chart.
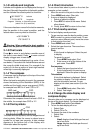
3-1-7 Find nearby services
To find and display nearby services:
1 To see services near the boat’s position, press
ESC to switch to centre on boat mode. To see
services near a different point, move the cursor
to that point on the chart.
2 Press MENU and select Find.
3 Select the type of service. There are three
types of service:
Ports
A list of ports is displayed. Select the port
to display.
To search for a port:
i Press MENU and select Find.
ii Enter some or all of the letters of the
port name. Press ENT.
Port services
i Select the type of service to find.
ii A list of places with this service are
displayed. Select the place to display.
Tide stations
A list of tide stations is displayed. Select
the station to display. The chart redraws
with the tide station centred. To now
display a tide chart (see section 8) for the
station:
i Press MENU and select Chart info.
ii Select Tide height.
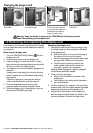
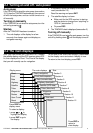
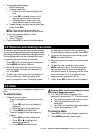
3-1-8 Change the data display and
compass display
Numeric data and a compass can be displayed at
the top of the chart display. To change these:
1 Press MENU and select Data header.
2 To turn the data display off or on:
i Select Data.
ii Select Off or On.
3 To choose the size of the numbers:
i Select Size.
ii Select:
Small: displays three fields per line and
up to four lines.
Large: displays two fields per line and
up to four lines.
BRG (red)
COG
COG
Minutes, to 3 decimal places
(about 2 m (6 ft) resolution)
Degrees
36° 29.637' S
175° 09.165
' E
Latitude
Longitude
+ 36° 29.684' S
175° 09.201
' E