


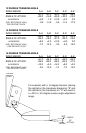
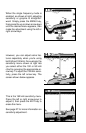
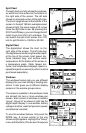
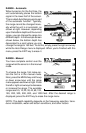

Split Chart
The split chart normally shows the underwa-
ter world from the surface to the bottom on
the right side of the screen. The left side
shows an enlarged version of the right side.
The zoom range shows at the bottom of the
screen. In the split 192 kHz example screen
shown at right, the zoom range is 2X, or two
times the right side's view. By pressing the
ZOUT and ZIN keys, you can change the left
side's zoom from 2X to 4X and back. You
can switch the split chart screen from 192
kHz to split 50 kHz to 192/50 or 50/192.
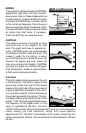
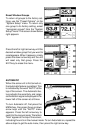
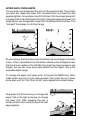
Digital/Chart
The digital/chart shows the chart on the
right side of the screen. The left side has
four digital boxes containing the water depth
at the top of the screen, boat speed, dis-
tance travelled (log), and surface water
temperature. At the bottom of the screen is
a temperature graph. (Note: Speed, dis-
tance, and temperature displays require a
speed/temperature sensor(s) which must be
purchased separately.)
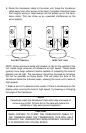
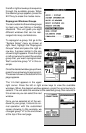
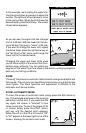
Windows
The windows feature lets you use different
displays for your own fishing or boating situ-
ations. It also gives you 8 different display
screens in the window groups alone.
The screens available in the windows mode
are divided into two or more windows per
screen. Each screen of windows is called a
“group”. Group “A” as shown at right has the
digital depth display in one window, battery
voltage in another, water temperature, speed,
and distance travelled.
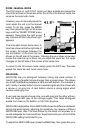
To use the windows feature, first press the
MODE key. A screen similar to the one
shown at right appears. Highlight the "Group"
menu at the bottom of the screen. Now press