


1. OPERATIONAL OVERVIEW
1-44
Depth and water temperature graphs
These graphs display the latest 30 minutes of respective data. The horizontal axis scale is fixed
and data is plotted at intervals of 10 seconds. The vertical axis scale is adjusted automatically for
every 30 minutes of data. The unit of measurement may be chosen on the Initial sub menu in the
System menu.
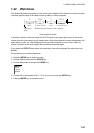
Wind graph
WInd direction reference may be chosen (on the Initial sub menu) from True or Apparent.
Apparent wind is the direction (in relation to ship’s bow) and speed of the wind as it appears to
those on board, relative to the speed and direction of the boat; combination of the true wind and
the wind caused by the boat's movement. True wind is the speed and direction (in relation to
ship’s bow) of the wind felt or measured when stationary.
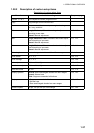
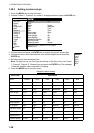
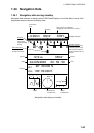
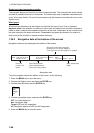
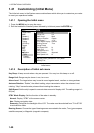
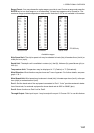
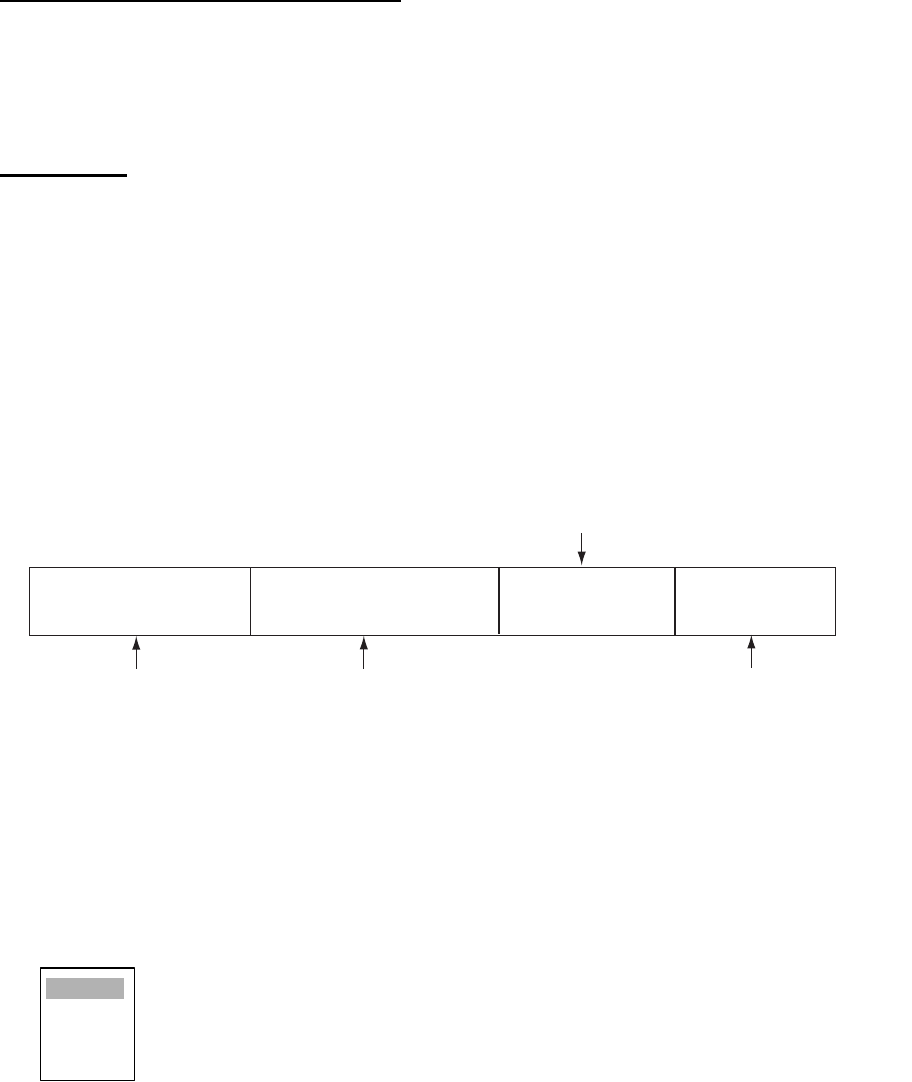
1.34.2 Navigation data at the bottom of the screen
Navigation data may be displayed at the bottom of the screen.
Navigation data
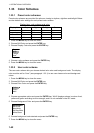
To show navigation data at the bottom of the screen, do the following:
1. Press the MENU key to open the menu.
2. Choose the Display menu and press the ENTER key.
3. Choose Data Box and press the ENTER key.
4. Choose appropriate option and press the ENTER key.
Off: Turn data display off.
Nav: Navigation data
Target: ARP and AIS target data
All: Navigation data plus ARP and AIS target data
5. Press the MENU key to close the menu.
OWN LAT: 34
°
56.123 N
SHIP LON: 135
°
34.567 E
SPEED 12.3 kt
CURSOR LAT: 34
°
56.123 N
LON: 135
°
34.567 E
TTG: 01:00
TEMP 12.3
°
C
DEPTH 56.7 m
WAY 14.80 NM
POINT 202.2
°
TTG: 00:20
Own ship
position and
speed
Cursor latitude position
Cursor longitude position
Time to go to cursor position
Range from own ship to waypoint
Bearing from own ship to waypoint
Time to go from own ship position to waypoint
Water temperature,
Depth
Off
Nav
Target
All