


44 GPSMAP 188/188C Sounder Owner’s Manual
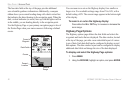
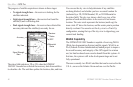
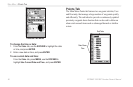
MAIN MENU > TIDE TAB
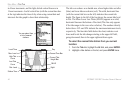
in 4-hour increments, and the light, dotted vertical lines are in
1-hour increments. A solid vertical line (with the current time box
at the top) indicates the time of day when using current date and
intersects the tide graph to show their relationship.
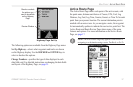
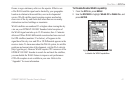
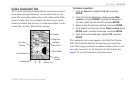
You can select from
a list of nearest
stations.
Local Time
Station Time
Day
Night
MLLW
Current Time Bar
Max. Level
Min. Level
Current Tide
Height Bar
High Tide
Curve
Low Tide
Curve
The tide curve shows as a shaded area, where higher tides are taller
(blue) and lower tides are shorter (red). The solid, horizontal line
(with the current tide box on the left) indicates the current tide
height. The figure to the left of the line shows the current tide level
in feet. The Mean Lower Low Water (MLLW) appears as a solid,
horizontal line near the bottom of the chart (This line only appears
if the tide ranges to the zero value or below). The numbers directly
below/above LCL and STA indicate the maximum/minimum levels,
respectively. The four data fields below the chart, indicate event
times and levels the tide changes starting in the upper left field,
going downward, then to the upper right and down again.
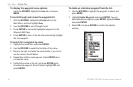
To select the nearest tide station from you current
location:
1. From the Tide tab, highlight the At field, and press ENTER.
2. Highlight a tide station on the list, and press ENTER twice.