


92
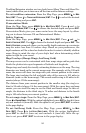
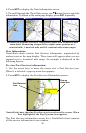
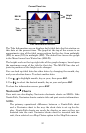
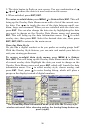
Tide Information screen.
The Tide Information screen displays daily tidal data for this station on
this date at the present time. The graph at the top of the screen is an
approximate view of the tidal range pattern for the day, from midnight
(MN) to noon (NN) to midnight (MN). The dotted line across the graph
is the Mean Lower Low Water line (MLLW).
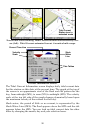
The height scale on the top right side of the graph changes, based upon
the maximum range of the tide for that day. The MLLW line also ad-
justs its position as the height scale changes.
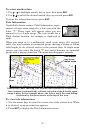
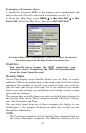
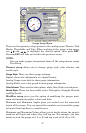
You can look up tidal data for other dates by changing the month, day
and year selection boxes. To select another date:
1. Use ← → to highlight month, day or year, then press
ENT.
2. Use ↑ ↓ to select the desired month, day or year and press
ENT.
To clear the information screen, press
EXIT.
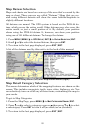
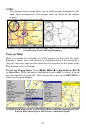
Navionics
®
Charts
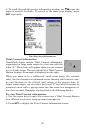
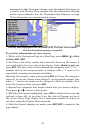
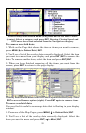
Your unit can also display Navionics electronic charts on MMCs. Like
NauticPath, Navionics charts contain tide and port service information.
NOTE:
The primary operational difference between a NauticPath chart
and a Navionics chart is the way the chart data is set up for dis-
play. NauticPath charts are ready for display as soon as they are
inserted into the unit. Navionics charts must be inserted into the
unit, then selected as a Map Choice option in the Map Data menu.
Height
Scale
MLLW
Line
Tide
Table
Current Time Line