


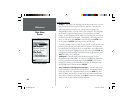
49
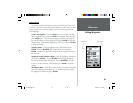
Getting Started
49
Reference
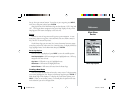
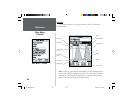
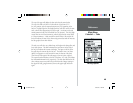
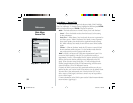
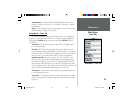
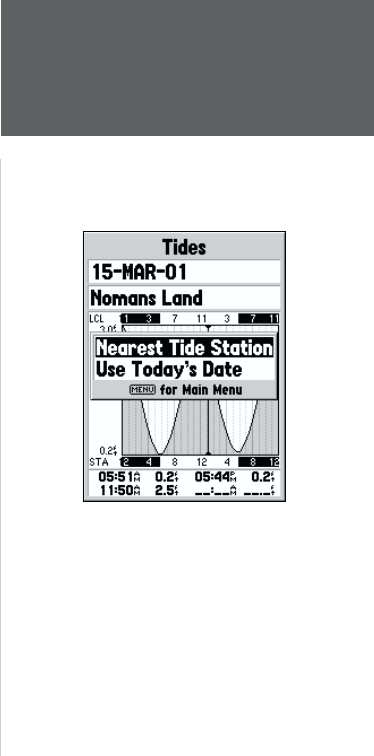
The top of the page will display the date with the tide station below.
The top of the chart will show a 24-hour block of local time (LCL)
for your position, with the reported station time (STA) appearing at the
bottom. Daylight (light bar) and night (dark bar) will show across the time
scale, with the time progressing from left to right. (Local time scales and
sunrise/sunset info may not be available for a few stations). The solid, light
vertical lines are in 4-hour increments, with the light, dotted vertical lined
in 1-hour increments. A dark vertical line (with arrows at the ends of the
line) will indicate the time of day when using current date and will intersect
the tide graph to show their relation.
The tide curve will show as a shaded area, with higher tides being taller and
lower tides shorter. The dark horizontal line (with arrows at the ends of
the line) will indicate the current tide height. The fi gure to the left of the
line will show the current tide level in feet. The Mean Lower Low Water
(MLLW) will appear as a solid vertical line near the bottom of the chart
(This line will only appear if the tide ranges to the zero value or below).
The top and bottom numbers to the left of the chart, ‘LCL and ‘STA’ indicate
the maximum/minimum levels, respectively. The four data fi elds below the
chart, indicate event times and levels at which the tide changes starting in
the upper left fi eld, going downward, then to the upper right and down
again.
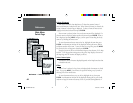
Main Menu
Celestial — Tides
Tide Page Options
190-00229-00.indd 07/25/01, 11:23 AM49