


14 Colorado
™
Series Owner’s Manual
applIcatIonS
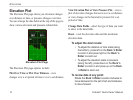
Elevation Plot
The Elevation Plot page shows you elevation changes
over distance or time, or pressure changes over time.
You can change the data elds at the top of the page to
show various elevation and pressure-related data.
Elevation Plot Page
The Elevation Plot page options include:
Plot Over Time or Plot Over Distance—view
changes over a set period of time or over a set distance.
View Elevation Plot or View Pressure Plot—view a
plot of elevation changes that occur over a set distance
or view changes in the barometric pressure for a set
period of time.
Change Data Fields—select the type of data you want
to show in the data elds.
Reset—reset the elevation data and the maximum
elevation data.
To adjust the zoom levels:
To adjust the distance or time scale (along
the bottom), press left on the Rock ‘n Roller
to zoom in and press right on the Rock ‘n
Roller to zoom out.
To adjust the elevation scale or pressure
(along the left), press down on the Rock ‘n
Roller to zoom in and press up on the Rock
‘n Roller to zoom out.
To review data at any point:
Rotate the Rock ‘n Roller counter-clockwise to
move backward on the plot chart and clockwise
to move forward.
•
•