


Page 30 of 44
Catalog #91001, 91003, 91004, 91005, 91007, 91009
Rev. 2/06 - RS/mc
©2006 Edelbrock Corporation
Brochure #63-0282
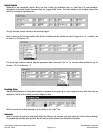
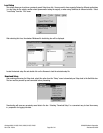
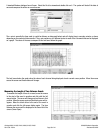
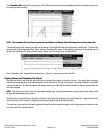
A standard Windows dialogue box will open. Select the file to be viewed and double click on it. The system will load all the data at
once and compress the entire run on one screen.
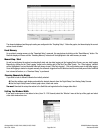
The x-axis is normally the time scale (or could be distance as discussed below) and will display time in seconds, minutes, or hours
depending on the amount of data recorded. The y-axis contains up to 9 different scales for each of the 9 channels that can be displayed
on a graph. The colors of the axes correspond to the text boxes below the graph.
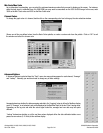
The text boxes below the graph show the value of each channel being displayed at each current cursor position. Move the mouse
across the screen and these values will change.
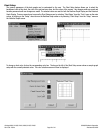
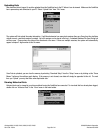
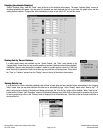
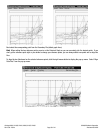
Measuring the Length of Time Between Events
To measure the length of time of an event, move the mouse
to the start of the event in question and click with the left
mouse button. The cursor will change red and freeze in that
position. Move the mouse again and the black cursor will re-
appear. Move the black cursor to the end of the event in
question and click the left mouse button again. The time
between the cursors will be displayed in the lower left of the
screen (Cursor Span).