21
SAFETY
Operator Safety
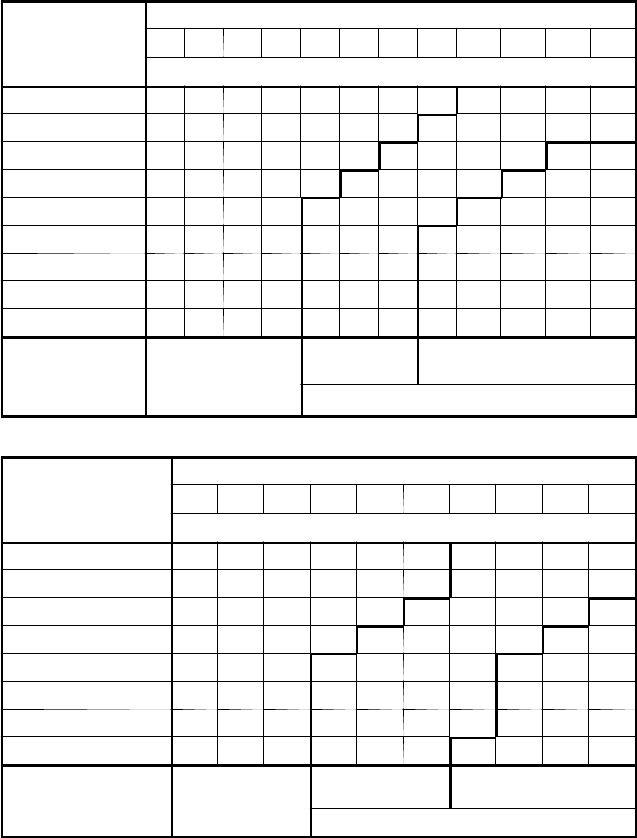
Windchill/Temperature Charts
The following information is provided to help you determine when
temperatures become dangerous for riding.
WIND CHILL CHART (°F)
Estimated Wind
S
p
e
e
d
i
n
M
P
H
Actual Thermometer Reading (°F)
Speed in MPH
50 40 30 20 10 0 -10 -20 -30 -40 -50 -60
Equivalent Temperature (°F)
Calm 50 40 30 20 10 0 -10 -20 -30 -40 -50 -60
5 48 37 27 16 6 -5 -15 -26 -36 -47 -57 -68
10 40 28 16 4 -9 -21 -33 -46 -58 -70 -83 -95
15 36 22 9 -5 -18 -36 -45 -58 -72 -85 -99 -112
20 32 18 4 -10 -25 -39 -53 -67 -82 -96 -110 -124
25 30 16 0 -15 -29 -44 -59 -74 -88 -104 -118 -133
30 28 13 -2 -18 -33 -48 -63 -79 -94 -109 -125 -140
35 27 11 -4 -20 -35 -49 -67 -82 -98 -113 -129 -145
40 26 10 -6 -21 -37 -53 -69 -85 -100 -116 -132 -148
Wind Speeds Great-
er Than 40 MPH
H
a
v
e
Li
t
t
l
e
A
d
d
e
d
Little Danger
(For Properly
C
l
o
t
h
e
d
P
e
r
s
o
n
)
Increasing
Danger
Great
Danger
H
a
v
e
L
i
t
t
l
e
A
d
d
e
d
Effect
C
l
o
t
h
e
d
P
e
r
s
o
n
)
Danger From Freezing of Exposed Flesh
WIND CHILL CHART (°C)
Estimated Wind Speed
i
n
K
P
H
Actual Thermometer Reading (°C)
in
K
PH
5 0 -5 -10 -15 -20 -25 -30 -35 -40
Equivalent Temperature (°C)
0 5 0 -5 -10 -15 -20 -25 -30 -35 -40
10 1 -4 -11 -16 -22 -27 -33 -38 -45 -50
20 -4 -9 -17 -23 -29 -36 -42 -48 -54 -61
30 -7 -13 -21 -28 -35 -42 -48 -55 -63 -69
40 -9 -16 -24 -32 -39 -47 -53 -61 -69 -76
50 -11 -18 -26 -34 -41 -49 -57 -64 -73 -80
60 -12 -19 -27 -35 -43 -51 -59 -66 -75 -82
70 -13 -20 -28 -36 -44 -52 -60 -68 -76 -84
Wind Speeds Greater
Than 70 KPH Have Little
A
d
d
e
d
E
f
f
e
c
t
Little Danger
(For Properly
C
l
o
t
h
e
d
P
e
r
s
o
n
)
Increasing
Danger
Great
Danger
A
dded E
f
f
ect
C
lothed Person
)
Danger From Freezing of Exposed Flesh


