


Northstar M121/M84 Installation and Operation Manual74
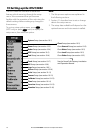
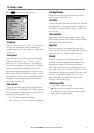
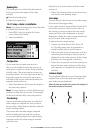
General submenu
Plotter mode Only scales available on the chart card can be displayed.
If you press or to select a chart scale which is not available, on the chart card, the chart win-
dow will change to this scale but will only display the boat position and track (if enabled). The rest of
the window is white with black crosshatch lines and no chart information is displayed. This is useful
to zoom to a small scale to track small boat movements or if there is no detailed chart for an area.
Mixing levels Mixes lower detail charts with higher detail charts on chart boundaries.
:Lower detail chart is not shown.
:Lower detail chart shown; this is slower to redraw.
Anticlutter
Names and icons shown. Note: this is independent of the change in detail shown at diff erent
zoom levels.
Hides some less important names and icons when they overlap to make the chart clearer.
Value added data
Non marine chart data shown
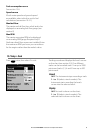
Projected course The Instrument can estimate the course after a given time, based on the current speed and heading
(see section 3-4). The options are 2 minutes, 10 minutes, 30 minutes, 1 hour, 2 hours or Off .
CDI scale See Appendix C. The options are 0.05, 0.1, 0.2, 0.5, 1.0, 2.0, 4.0 and 10.0 distance units.
Lat/lon grid
displays a latitude and longitude grid.
Boundaries Displays boundaries around areas where more detailed chart coverage is available: Auto shows the
next four detail levels; On shows all.
Text/icon size Select the size of chart text and icons.
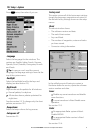
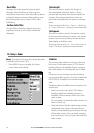
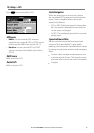
Water submenu
Water features displays nature of sea bed (for example, M shows areas of mud)
and tide station icons.
Bathymetric[s] lines Displays underwater depth contours between Bath & dndgs min
and max.
Spot soundings Displays underwater depth contours between Bath & dndgs min
and max.
Bath & sndgs min The minimum depth for Bathymetrics and Spot soundings.
Bath & sndgs max The maximum depth for Bathymetrics and Spot soundings.
Tidal stream
displays dynamic tide fl ows: arrows on a chart showing the present tide stream and orientation
(requires a GPS fi x and an NT-MAX card)
Land submenu
Land features displays land features, for example regions, rivers, roads, railways, airports.
Land elevation
displays land contours, shaded like depths (requires an NT Max card)
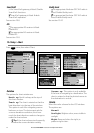
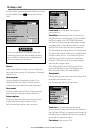
Other submenu
Waypoints Displays waypoints: Hide all only displays waypoints on any selected route; Selected displays
waypoints with their display option set to Icon or I+N (Icon and Name); Show all displays all
waypoints (see section 5).
Names
displays place names.
Lights Light House window options: Off hides all light indicators (the icon still shows); No sectors
hides sectors; On shows sectors; Animated activates light animation.
Note: with light animation enabled, animation only operates chart.
Nav-aids Displays signals (fog, radar, radio stations) and buoys. Int and US select the icon format; Simpl
draws simpler icons.
Attention areas
displays attention area boundaries and information icons ; attention areas are important areas,
such as restricted anchorages or shallow areas.