


85
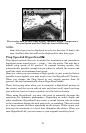
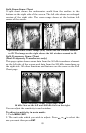
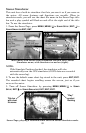
Split Zoom Sonar Chart
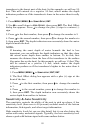
A split chart shows the underwater world from the surface to the
bottom on the right side of the screen. The left side shows an enlarged
version of the right side. The zoom range shows at the bottom left
corner of the screen.
Split Zoom Sonar Chart. Image (left) shows the left window zoomed
to 2X. The image on the right shows the left window zoomed to 4X.
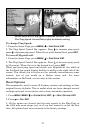
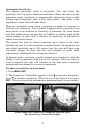
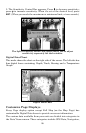
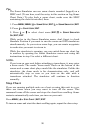
Split Frequency Sonar Chart
(Dual-Frequency Transducers only)
This page option shows sonar data from the 50 kHz transducer element
on the left side of the screen and data from the 200 kHz transducer on
the right side. All other functions and features are the same as the Full
Chart page.
Split Frequency Sonar Chart page, with
50 kHz view on the left and 200 kHz view on the right.
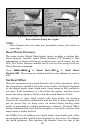
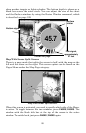
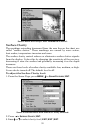
You can adjust the sensitivity in each window.
To adjust sensitivity in auto mode:
1. Press
MENU|ENT.
2. The unit asks which you wish to adjust. Press ← or→ to select the
one you want then press
ENT.