


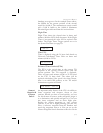

Course Deviation Indicator (CDI) and Distance Off
Track
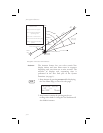
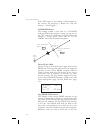
The triangle symbol (
“
) referenced to a bar graph
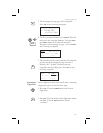
shows your position relative to being on-course.
When the bar graph is to the right of the triangle, you
must fly right to return on-course. In the example
below, the bar graph indicates you are off-course to
the right. Fly the aircraft in the direction of the bar
graph (left) to return on-course.
ete aSLE 00:37
#### “ 4.005
Brg 173¯ 42.4nm
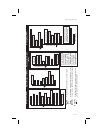
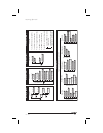
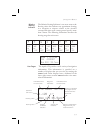
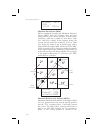
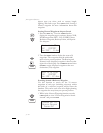
CDI Sensitivity = 0.3
nm
CDI Sensitivity = 1.0
nm
CDI Sensitivity = 5.0
nm
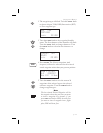
each
7 = 0.01 nm each $ = 0.05 nm each H = 0.24 nm
each
6 = 0.04 nm each z = 0.14 nm each B = 0.71 nm
“ ›››››››
(full scale) = 0.3 nm
“ ¼¼¼¼¼¼¼
(full scale) = 1.0 nm
“ ¥¥¥¥¥¥¥
(full scale) = 5.0 nm
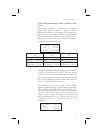
A single dot thickness bar indicates that CDI sensitivity
is set to 0.3 nm full scale per side. The two dot bar
indicates a sensitivity of 1.0 nm full scale per side. The
three dot bar indicates a sensitivity of 5.0 nm full scale
per side. The manual sensitivity of the CDI may be set
to 0.3, 1.0, or 5.0 nm full scale per side.
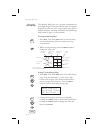
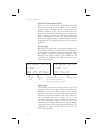
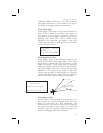
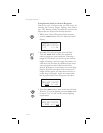
The number shown on the edge of the display
opposite from the triangle symbol shows the distance
off track. The numbered values of Cross Track Error
are in the direction you are off course. If the numbers
are on the left side, fly right to return on course. The
displayed value ranges are: 0.000 to 0.999 nm with
0.001 nm resolution, 1.0 to 9.99 nm with 0.01 nm
resolution, and 10.0 to 99.9 nm with 0.1 nm
resolution.
ete aSLE 00:37
0.006 “
Brg 173 42.4nm
3-5
Navigation Basics