Additional Graphing Topics 484
• Window Editor variables.
• Table setup parameters and Table screens.
• Graph formats such as
Coordinates, Axes, etc.
• Graph screens.
• Y= Editors. However, both graphs share common function and stat plot definitions.
Note: The Y= Editor is completely independent only when the two sides use different
graphing modes (as described below).
Independent graph-related applications (Y= Editor, Graph screen, etc.) can be displayed
on both sides of the screen at the same time.
Non-graph-related applications (Home screen, Data/Matrix Editor, etc.) are shared and
can be displayed on only one side at a time.
The Y= Editor in Two-Graph Mode
The Y= Editor in Two-Graph ModeThe Y= Editor in Two-Graph Mode
The Y= Editor in Two-Graph Mode
Even in two-graph mode, there is actually only one Y= Editor, which maintains a single
function list for each Graph mode setting. However, if both sides use the same graphing
mode, each side can select different functions from that single list.
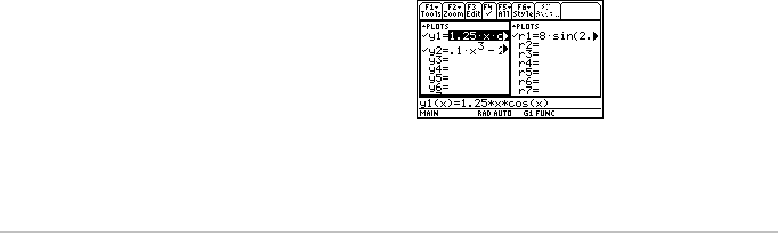
• When both sides use different graphing
modes, each side shows a different
function list.