72
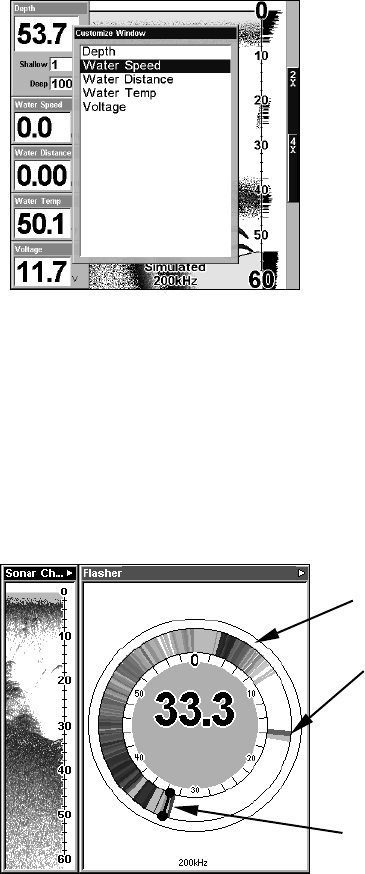
Options List for customizing Digital Data windows.
FlashGraf
The FlashGraf sonar page option represents a flasher style sonar com-
bined with a scrolling chart. A circular dial shows all returning echoes
at a high screen refresh rate.
It uses the Colorline feature to distinguish between strong and weak
signals. For example, fish, one of the weakest echoes, shows up as a
narrow blue line, while a hard bottom surface will be a thick yellow
band. The bottom depth is shown as a black bar across the outer circle.
There is also a narrow chart display on the left of the screen.
FlashGraf page.
Sonar Simulator
This unit has a built-in simulator that lets you run it as if you were on
the water. All sonar features and functions are useable. When in
simulator mode, you will see [Simulated] at the bottom of the display.
To use the simulator:
Bottom signal
Surface clutter
Fish signal,
approximately
16 feet


