


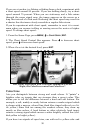
50
If you are at anchor, ice fishing or fishing from a dock, experiment with
a chart speed around 50 percent. If you are drifting slowly, try a chart
speed around 75 percent. When you are stationary and a fish swims
through the sonar signal cone, the image appears on the screen as a
long line instead of a fish arch. Reducing the chart speed may result in
a shorter line that more closely resembles a regular fish return.
If you do experiment with chart speed, remember to reset it to maxi-
mum when you resume trolling or moving across the water at higher
speed. To change chart speed:
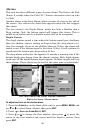
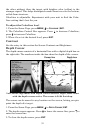
1. From the Sonar Page, press
MENU|↓ to CHART SPEED|ENT.
2. The Chart Speed Control Bar appears. Press ↓ to decrease chart
speed; press ↑ to increase chart speed.
3. When it's set at the desired level, press
EXIT.
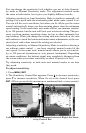
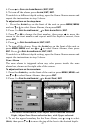
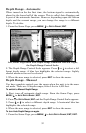
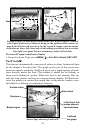
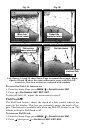
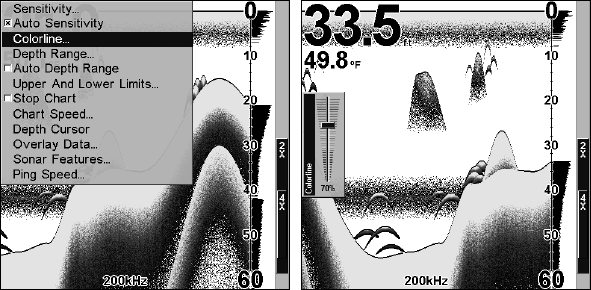
Left, Sonar Page menu with ColorLine command selected.
Right, the ColorLine control bar.ColorLine
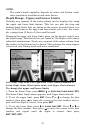
ColorLine
lets you distinguish between strong and weak echoes. It "paints" a
brighter color on targets that are stronger than a preset value. This
allows you to tell the difference between a hard and soft bottom. For
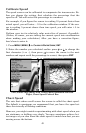
example, a soft, muddy or weedy bottom returns a weaker signal which
is shown with a narrow, colored line (dark blue tinged with red or a lit-
tle yellow.) Since fish are among the weakest echoes, they show up
mostly as blue arches. A hard bottom or other relatively hard target
returns a strong signal which causes a wider brightly colored line (red-
dish yellow to bright yellow.)
If you have two signals of equal size, one with red to yellow color and