


61
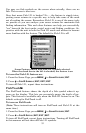
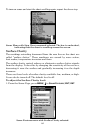
2. Press ↓ to
SONAR CHART MODE|ENT.
3. Press ↓ or ↑ to Mode Name|
ENT.
4. Press
EXIT|EXIT to return to the Sonar Page.
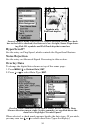
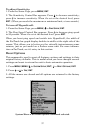
Sonar Page & Sonar Chart Display Options
The M68 offers four Sonar chart display options. To choose among
them, press
EXIT to clear any menus, then press PAGES and use the ar-
row keys to select the desired mode.
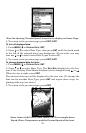
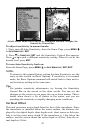
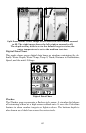
Full Sonar Chart
This is the default mode used when the Sonar is turned on for the first
time or when it's reset to the factory defaults.
The bottom signal scrolls across the screen from right to left. Depth
scales on the right side of the screen aid in determining the depth of
targets. The line at the top of the screen represents the surface. The
bottom depth and surface temperature (if the unit is equipped with a
temperature sensor or a transducer with a temp sensor built in) show
at the top left corner of the screen.
The FasTrack™ display shows just to the right of the scale. This
changes all echoes into short horizontal bars, replicating a flasher so-
nar. The zoom bar on the far right shows the area that's zoomed when
the zoom is in use. (See the Zoom section for more information.)
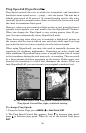
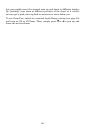
Full Sonar Chart. The Overlay Data (depth and water temperature)
are each set to a different text size.
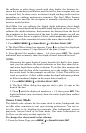
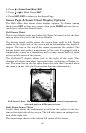
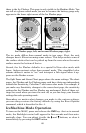
Split Zoom Sonar Chart
A split chart shows the underwater world from the surface to the bot-
tom on the right side of the screen. The left side shows an enlarged ver-
sion of the right side.
The zoom range shows at the bottom left corner of the screen.