


3
190-00607-06 Rev D
WSI Addendum
WSI - FIS
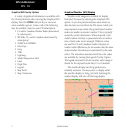
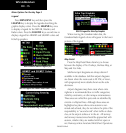
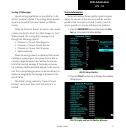
Menu Options for Overlay Page 1
WSI FIS Graphic Weather Overlay Menu Items (Page 1)
1. Press the OVRL function key to allow selec-
tion of the Overlay choices when viewing the
Graphical WX option.
2. Press
MENU/ENT to display menu items for
the Overlay. Press NEXT PAGE to see more
options.
US or Canadian Weather Radar
This option is only available when subscribed to
both radar products. WSI offers subscriptions for US
and Canadian radar data. Because of differences in
radar technology, both data types cannot be displayed
at the same time. When subscribed to both weather
radar products, you can alternate between the two
with the Overlay option.
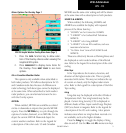
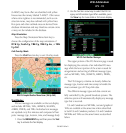
METARs
When enabled, METARs are available as colored
circles or diamonds at airports that provide METAR
reports. Press the METARs key to cycle through the
options of circular, diamond, or no METARs. Circles
depict the current METAR. Diamonds depict the
current weather condition. Refer to the Legend for
a description of the color code. US and Canadian
METARS use the same color coding and will be shown
at the same time with a subscription to both products.
SIGMETs & AIRMETs
When enabled, the following SIGMETs and
AIRMETs are available for display with repeated
presses of the Menu Item key :
• “SIGMETs” are for Convective SIGMETs
• “T AIRMET” is for Surface/Aloft Turbulence
AIRMETs
• “Z AIRMET” is for Icing AIRMET
•
“S AIRMET” is for an IFR condition, such as a
mountain obstruction
• “No Warn. Area” turns off all SIGMETs and
AIRMETs
These are collectively known as Warning Boxes and
are displayed as color coded outlines of the affected
area. Refer to the Legend for a description of the color
coding.
Echo Tops
Echo Tops indicate the location, elevation, and
direction of the highest radar echo. This is typically
associated with storms. This may not indicate the top
of a storm or clouds, only the highest radar return
echo. Refer to the Legend for a description of the Echo
Tops coding.
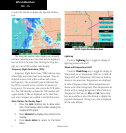
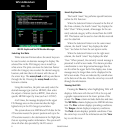
Icing
Icing data may be displayed with either Winds or
Temperatures Aloft. Two icing hazards may be dis-
played. Current Icing Severity (CIS) is displayed in
different shades of blue. Super-cooled Large Droplets
(SLD) are shown in magenta. Refer to the Legend for
a description of the CIS color coding. A dot pattern
indicates areas where no icing has been received or is
not available, such as the higher altitudes.
Press the Icing key to toggle the display of Icing
data on and off. Use the Alt+ and Alt- menu item keys