


6
190-00607-06 Rev D
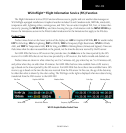
WSI Addendum
Menu Options for Overlay Page 3
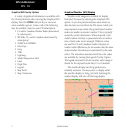
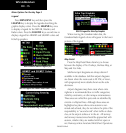
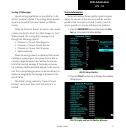
Legend
Press MENU/ENT key and then press the
LEGEND key to display the legends describing the
graphic display colors. Press the LEGEND key once
to display a legend for the METAR, Weather, and
Radar colors. Press the LEGEND key a second time to
display a legend for AIRMET and SIGMET colors and
EchoTop graphics.
WSI FIS METAR and Wx Legend (US)
WSI FIS Legend for AIRMET and SIGMET Colors
WSI FIS Current Icing Severity Legend
WSI FIS Legend for Echo Top Graphics
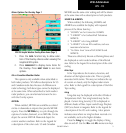
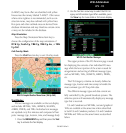
When viewing the Canadian radar data, the
Canadian Radar legend colors will appear in the lower
portion of the legend.
WSI FIS Legend for US and Canadian Radar
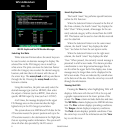
Map Detail
Press the Map Detail Menu Item key to choose
between the display of No Overlays, the Base Map, or
Map and Nav Aids.
SafeTaxi airport diagrams are always drawn if
available in the database. SafeTaxi airport diagrams
are drawn when the zoom scale is 20 NM, or lower,
with progressively more details shown as the scale
decreases.
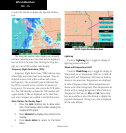
Airport diagrams may show areas where extra
vigilance is recommended due to traffic congestion,
visibility constraints, or other unique circumstances.
These areas are called hot spots and are identified by
circular or elliptical lines. Although these areas are
highlighted as places where extra caution is war-
ranted and advised, they do not relieve the pilot of the
responsibility to “see and avoid” other traffic or obsta-
cles, on the airport surface or in the air. All taxiway
and runway intersections should be approached with
caution, whether they are marked with hot spots or
not. Runways where Land and Hold Short Operations
WSI - FIS