


10. VIDEO SOUNDER OPERATION
10-24
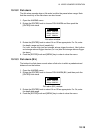
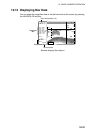
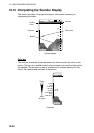
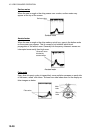
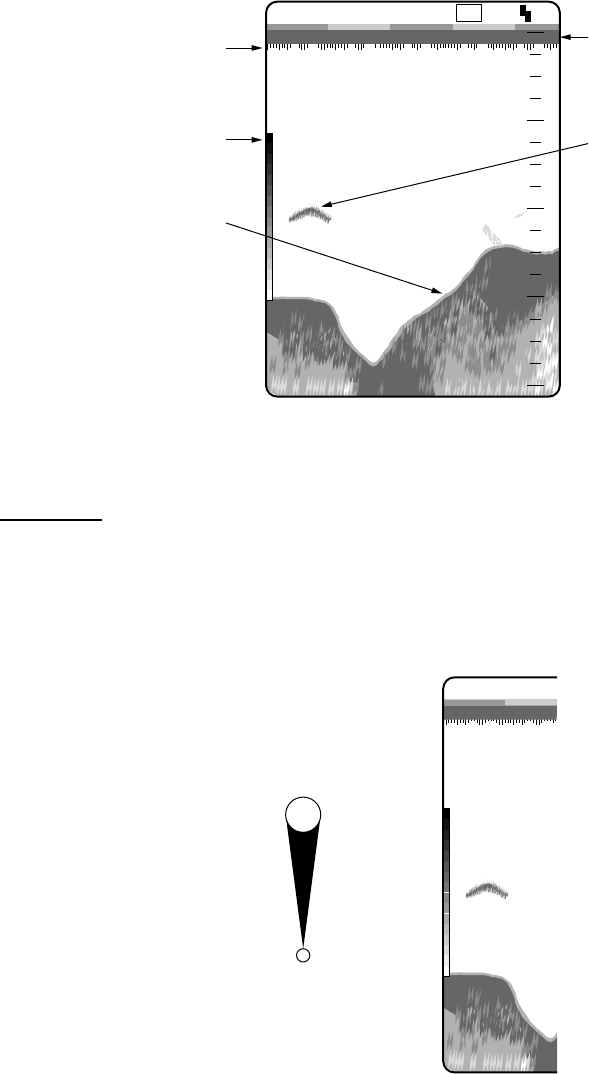
10.15 Interpreting the Sounder Display
This section provides, using typical examples, information necessary for
interpreting the display.
LF
49.6
1/1
m
0.0
20
40
60
80
0
0
Surface
noise
Color bar
Bottom
Zero line
Fish school
Typical display
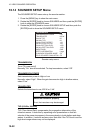
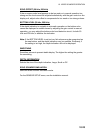
Color bar
The color bar shows the relation between echo intensity and echo color on the
screen. The top color (reddish brown) is the strongest color and the lower colors
the weakest. The bar can be used as a reference to estimate density of a fish
school, fish species and hardness of the bottom.
R-BRN
RED
ORANGE
YELLOW
GREEN
LIGHT-BLUE
BLUE
DEEP BLUE
Weak
Strong
No signal
49.6
m
Color bar