


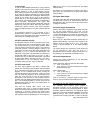
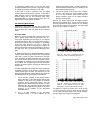
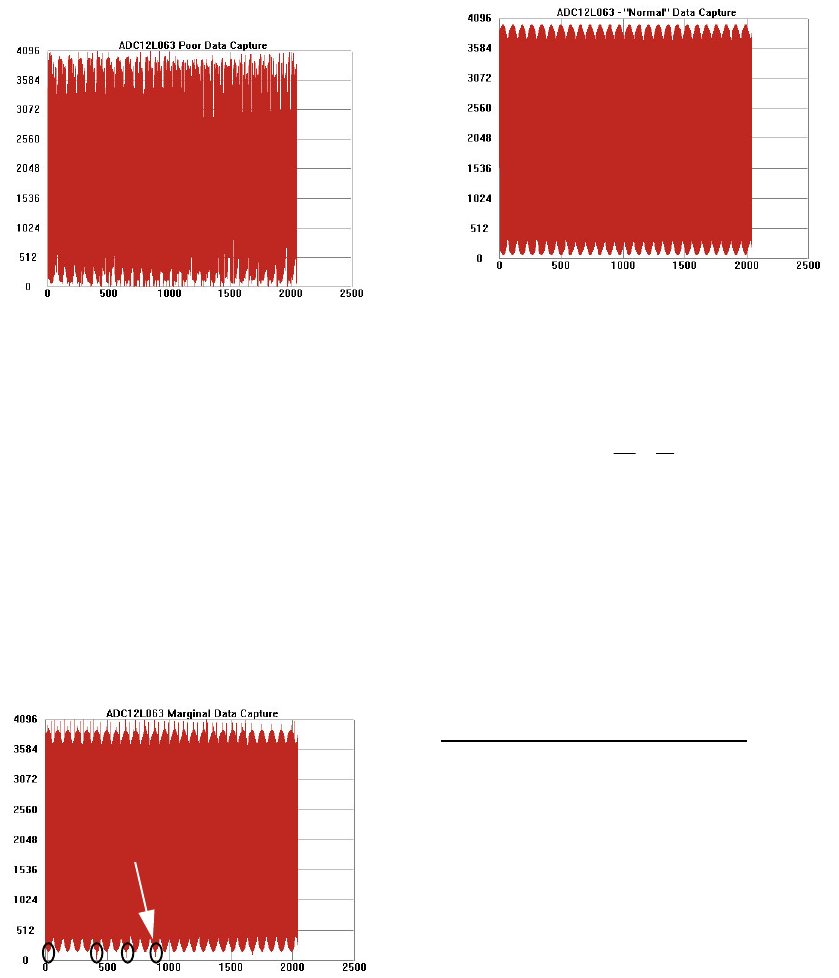
If your data capture results in something similar to what is
shown here in Figure 3 or in Figure 4, take another
sample. It may take a few trials to get good data.
Figure 4 Marginal data capture that results from trying to
capture data that is near but not right at the point where the
ADC outputs are in transition.
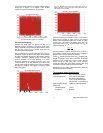
Figure 5. Normal data capture.
Coherent sampling of a periodic waveform occurs when a
prime integer number of cycles exists in the sample
window. The relationship between the number of cycles
sampled (CY), the number of samples taken (SS), the
signal input frequency (f
in
) and the sample rate (f
s
), for
coherent sampling, is
Figure 3. Poor data capture resulting from trying to capture
data while the ADC outputs are in transition
6.2 Coherent Sampling
Artifacts can result when we perform an FFT on a
digitized waveform, producing inconsistent results when
testing repeatedly. The presence of these artifacts means
that the ADC under test may perform better than the
measurements would indicate.
CY
SS
f
in
f
s
=
CY, the number of cycles in the data record, must be a
prime integer number and SS, the number of samples in
the data record, must be a factor of 2 integer.
We can eliminate the need for windowing and get more
consistent results if we observe the proper ratios between
the input and sampling frequencies. We call this coherent
sampling. Coherent sampling greatly increases the
spectral resolution of the FFT, allowing us to more
accurately evaluate the spectral response of the A/D
converter. When we do this, however, we must be sure
that the input signal has high spectral purity and stability
and that the sampling clock signal is extremely stable
with minimal jitter.
Further, f
in
(signal input frequency) and f
s
(sampling rate)
should be locked to each other so that the relationship
between the two frequencies is exact. Locking the two
signal sources to each other also causes whatever
sample-to-sample clock edge timing variation (jitter) that
is present in the two signals to cancel each other.
Windowing (an FFT Option under WaveVision) should be
turned off for coherent sampling.
7.0 Evaluation Board Specifications
Board Size: 6.5" x 3.5" (16.5 cm x 8.9 cm)
Power Requirements: +5.0V, 100 mA (ADC12040 /
ADC12010 / ADC12020) or
+3.3V, 120 mA (ADC12L063)
+5V @ 30 mA / 1A (see Sect 4.6)
Clock Frequency Range: 1.0 MHz to 40 MHz or 60 MHz
Analog Input
Nominal Voltage: 1.4V
P-P
Impedance: 50 Ohms
7 http://www.national.com