


8
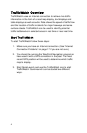
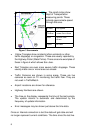
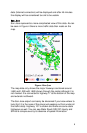
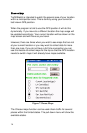
• The small circles show
Dept of Transportation
measuring points. These
indicate approximate speed
through the area.
Green full speed
Yellow some slow down
Red severe slow
down
open no data
Figure 3 Sacramento
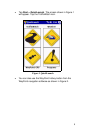
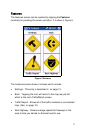
• Yellow Triangles show incidents (often accidents or other
traffic stoppage) or congestion. These are usually reported by
the Highway Patrol (State Police). There are some examples of
these in figure 4 which shows San Jose.
• Red Triangles are even more severe traffic stoppage. These
usually mean one or more lanes are closed.
• Traffic Cameras are shown in some areas. These are live
cameras as seen on TV monitoring the traffic flow. They are
not used in TrafficWatch.
• Airport Locations are shown for reference.
• Highway Numbers are shown.
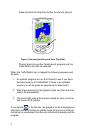
• The time on the display represents the time of the last sample.
The update interval is automatic and determined by the
frequency of update information.
• Error messages may be shown just above the time data.
Once an Internet connection is lost the data will get stale and will
no longer represent current conditions. The time since the last live