


5-1
5. MARKS AND DATA
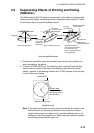
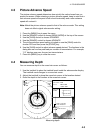
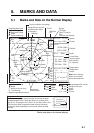
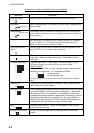
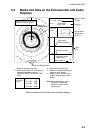
5.1 Marks and Data on the Normal Display
500
3
B
W
372 freeze
359
96
B 60S
450
15
( 121)
NW
R 1000
Fish Mark*
Latest Event
Mark*
Target Lock
Mark*
Range Ring,
Range Ring Data
R 450 B 224°
Ship’s Track*
Current Mark*
Trackball Mark
Range Mark
Stablilizer
Mark*
TX OFF STAB
R 1000
T 15
°
(15)
G 10.0
F1
SHIP SPEED
12.4 kt
SHIP COURSE
246°
LAT/LON
32°52.150N
132°12.150E
DEPTH
126m
WATER CURRENT
C1
1.2kt 342°
C2
0.8kt 298°
C3
0.4kt 256°
WATER TEMP
12.0°C
20min 10 0
14
12
10
557
149
SW/W
238
493
132
(m) C ESE
Own Ship
Mark
Heading Mark
Trackball Mark Data
Slant Range
Horizontal Range
Depth
B Relative Bearing*
Event Mark Data*
Horizontal Range
Depth
( )Depth at time of entry
BTrue Bearing*
B
1
Range and
Bearing Data
S 10.5kt
Range between fish marks
Range to fish mark
Depth
Speed
Course
238
493
132
(m) C ESE
S 10.5kt
Fish Mark Data*
B
557
149
SW/W
Target Lock Data*
Range
Depth
Bearing
2
North Mark*
Range (Shown several
seconds when range
is changed.)
TX Off
Stabilizer
On*
Speed*
Course*
Position*
Depth*
Current Data
(current speed
and direction
for 3 layers)*
Temperature*,
Temperature
Graph*
Range
Tilt Angle
(Auto Tilt value)
Gain
Function Key Number
Freeze condition (for testing)
* =Requires appropriate sensor.
S
E
N
N
1
Event Mark*
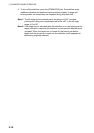
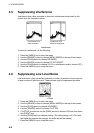
Temperature Graph
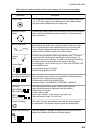
The temperature graph plots the latest 20 minutes of water
temperature data, with a solid light blue line, scrolling from
right to left. The range of the y-axis is 5° and that of the x-axis
is 20 minutes. When temperature data is lost a horizontal
dashed line starts extending from the point where the data
was lost.
Note:No or missing
data in text window
shown with asterisks.
20min 10 0
14
12
10
Temperature data lost
Temperature
data regained
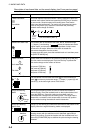
Own Ship Position
Mark*
Bearing Mark
Heading*
Bearing
Scale
Bearing
Mark
2nd Latest Fish Mark*
Fish Mark*
Marks and data on the normal display