Controls and Features
11
The ExpertMeter is actually a miniature
spectrum analyzer. It shows what band
each signal is and its signal strength.
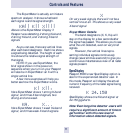
KA
||
K
||
X
||||
Above is the ExpertMeter Display if
Passport was detecting 2 strong Ka-band,
2 strong K-band, and 4 strong X-band
signals.
As you can see, there are vertical lines
after each band designator. Each line shows
a signal being detected. The height of each
line shows the relative signal strength of
that signal.
NOTE: If you use ExpertMeter, the
brief signal shown in the power-on
sequence when you turn on your Passport
will also be in ExpertMeter: an X with a
single vertical line.
A few more examples will help you
better see how the ExpertMeter works.
K
|
X
|||
Here ExpertMeter shows 1 strong K-band
signal, and three X-band signals, two
strong and one weak.
KA
|
X
|||
Here ExpertMeter shows 1 weak Ka-band
signal, and three weak X-band signals.
X
On very weak signals, there will not be a
vertical line at all. This shows a very weak
X-band signal.
ExpertMeter Details
The band designators (X, K, Ka) will
stay on the display for a few seconds after
the signal has passed. This allows you to see
what the unit detected, even on very brief
signals.
However, the vertical lines repre-
senting individual signals continuously
change (several times a second) to give you
a continuous instantaneous view of all radar
signals present.
SpecDisplay
Passport 8500’s new SpecDisplay option is
also for the experienced detector user. In
this mode, Passport will display the actual
numeric frequency of the radar signal being
received.
K 24.150
SpecDisplay shows one K-band signal at
24.150 gigahertz.
Note: Even long-time detector users will
require a significant amount of time to
get familiar with this new level of
information about detected signals.


