Chapter 2 Experimental Setup 17
Performance Guidelines for AMD Athlon™ 64 and AMD Opteron™
ccNUMA Multiprocessor Systems
40555 Rev. 3.00 June 2006
characterization of the resource behavior in the system. These recommendations, coupled with these
interesting cases, provide an understanding of the low-level behavior of the system, which is crucial
to the analysis of larger real-world workloads.
2.3 Reading and Interpreting Test Graphs
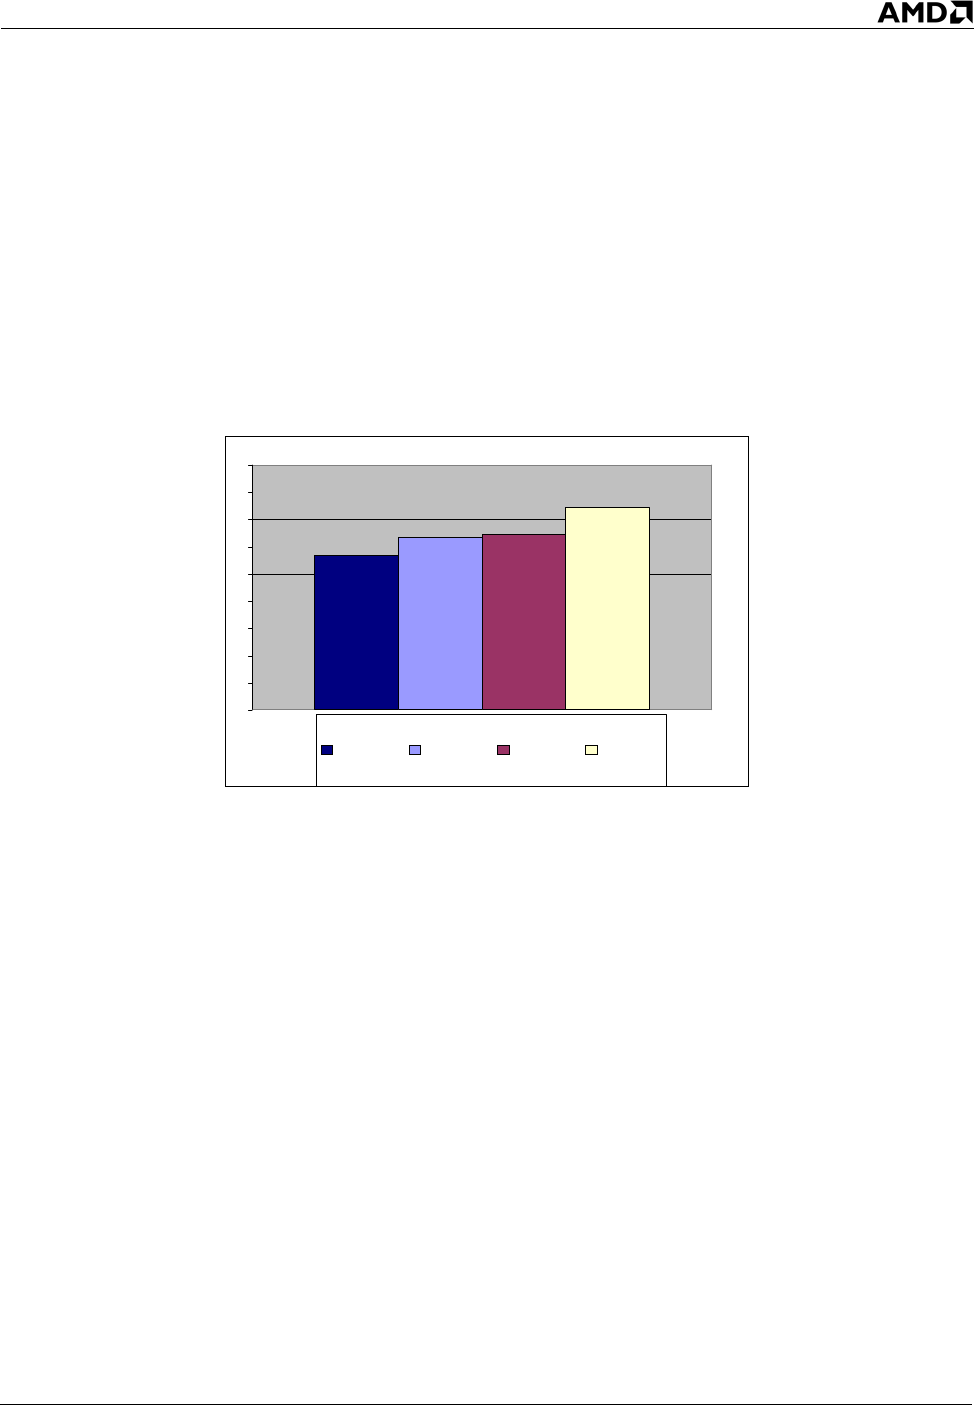
Figure 3 below shows one of the graphs that will be discussed in detail later.
Figure 3. Write-Only Thread Running on Node 0, Accessing Data from 0, 1 and 2
Hops Away on an Idle System
2.3.1 X-Axis Display
The X-axis displays the various thread and memory placement combinations to be compared. Each
case shows the following information for the thread, in the order listed:
• The node and core on which the thread is run.
• Whether accesses are read-only or write-only.
• The node on whose physical memory the data accessed by the thread resides.
In Figure 3 above, the four bars correspond to the following thread combinations:
0.0.w.0—Thread running on node 0/core0 does write-only accesses to memory resident on node 0.
0.0.w.1—Thread running on node 0/core0 does write-only accesses to memory resident on node 1.
0.0.w.2—Thread running on node 0/core0 does write-only accesses to memory resident on node 2.
0.0.w.3—Thread running on node 0/core0 does write-only accesses to memory resident on node 3.
Time for write
113%
127%
129%
149%
0
0.2
0.4
0.6
0.8
1
1.2
1.4
1.6
1.8
0.0.w.0 0.0.w.1 0.0.w.2 0.0.w.3
0 Hop 1 Hop 1 Hop 2 Hop