


ToolStick-EK
Rev. 0.2 3
5.1. Connecting to the Device and Downloading Firmware
This section describes how to open the IDE, open and build a project, connect to a device and download the firmware.
1. Open the Silicon Laboratories IDE from the Start
→
Programs
→
Silicon Laboratories menu
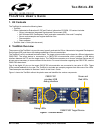
2. Connect the ToolStick to a USB port on the PC
3. In the IDE, go to Project → Open Project
4. Browse to C:\SiLabs\MCU\Demos\ToolStick\Blink_LED\
5. Select Blink_LED.wsp and click OK
6. In the IDE, select Project → Rebuild Project
7. Go to Options → Connection Options
8. Select “USB Debug Adapter” for the Serial Adapter and “C2” for the Debug Interface, and then click “OK”
9. Go to Debug → Connect
10. Download the code using the download button on the menu bar or use alt-D
Once these steps are completed, the firmware is built into an object file (step 6) and downloaded to the device
(step 10). The device is now ready to begin executing code. If all of these steps were followed successfully, the
“Go” option is enabled in the Debug menu. A green circle icon in the IDE toolbar also indicates that the device is
ready to run. If one of the steps leads to an error, make sure that the ToolStick is properly inserted in a USB port
and start again with step 3.
5.2. Running and Stopping Code Execution
Once the IDE is connected to the device and the firmware is loaded, the IDE can start and stop the code execution.
The following steps can be performed using the buttons on the toolbar or using the options in the Debug menu.
1. To start code execution, click the green “Go” button on the toolbar or use the Debug
→
Go menu option.
The green and red LEDs on the ToolStick will start to alternately flash. The debug commands on the IDE
(single-step, multiple-step, set breakpoint, and others) are disabled when the device is running.
2. To stop code execution, click the red “Stop” button on the toolbar or use the Debug → Stop menu option.
The device will halt code execution and all of the registers and pin on the device will hold their state. When
the ToolStick firmware is stopped, one of the LEDs will be on and the other will be off.
All debug windows and watch windows are refreshed when the device is stopped. If any of the values in these win-
dows have changed since the last time the device was halted, the new value is shown in red text instead of black text.
5.3. Viewing and Modifying Registers
All registers on the device can be viewed and modified when the device is in a halt state. The registers are grouped
together according to which peripheral or part of hardware they belong. As an example, this guide shows how to
open the Ports Debug Window and modify the status of the port pins directly from the IDE.
1. Open the Ports Debug Window from the View
→
Debug Windows
→
SFR’s
→
Ports menu option. The Ports
Debug Window appears on the right-hand side of the IDE. The logic value of the Port 0 pins is stored in the
P0 register. If the value of P0 is 0xF7, port pin P0.2 is high and the red LEDs on the ToolStick are on and the
green LEDs are off. If the value of P0 is 0xFB, port pin P0.3 is high and the green LEDs are on and the red
LEDs are off.
2. To enable both LEDs at the same time, the logic level of pins P0.2 and P0.3 need to be high. In the Ports
Debug Window, double-click on the P0 value to move the cursor. Change the value of P0 to 0xFF, then
select Debug → Refresh. This will write the value of 0xFF directly to the Port 0 pins and the pins will reflect
the value immediately. This can be confirmed by looking at the ToolStick.
3. Click on the “Go” button or select Debug → Go. The device will resume execution and the LEDs will con-
tinue to blink synchronously.
4. Click on the “Stop” button.
5. In the Ports Debug Window, change the value of P0 to 0xF7 or 0xFB, and then click the Refresh button.
This will have the LEDs blink alternately as before.