


Using Sonar
GPSMAP 400/500 Series Owner’s Manual 55
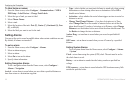
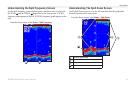
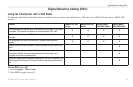
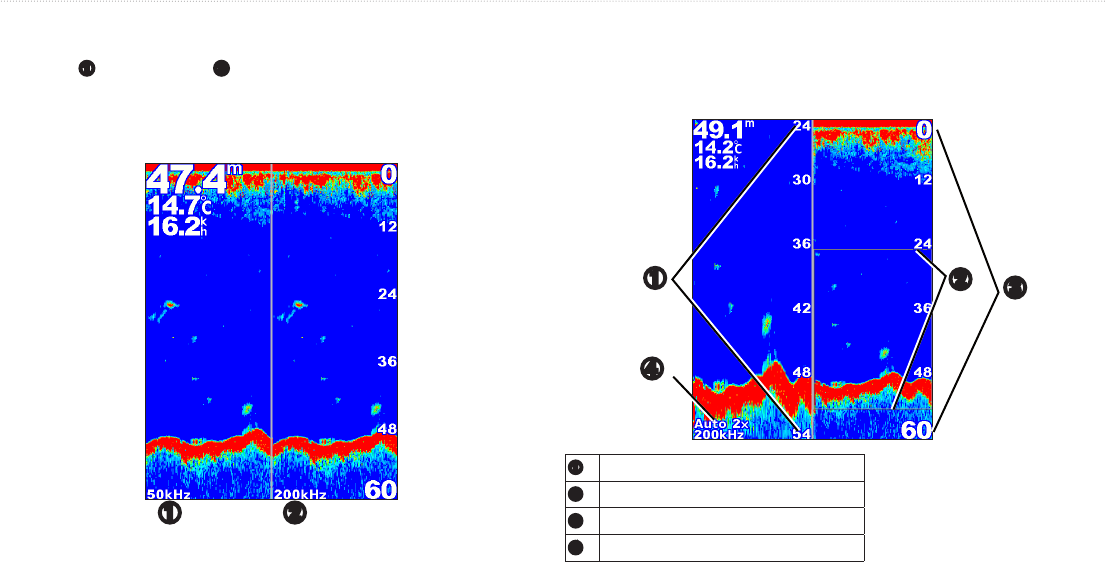
Use the Split Frequency screen (dual-frequency transducer only) to view both
the 50 kHz
➊
and the 200 kHz
➋
frequencies on the same screen. A 50 kHz
frequency graph appears on the left. A 200 kHz frequency graph appears on the
right.
From the Home screen, select > .
➊ ➋
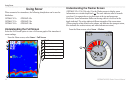
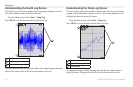
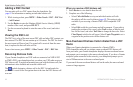
Use the Split Zoom screen to view the full sonar data from the graph and a
zoomed in portion on the same screen.
From the Home screen, select > .
➌
➋
➊
➍
➊
Zoomed depth scale
➋
Zoom window
➌
Range
➍
Zoom level and transducer frequency