


17
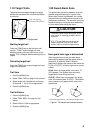
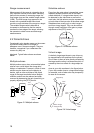
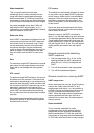
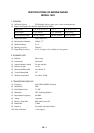
Shadow sectors
Funnels, stacks, masts, or derricks in the path of
the antenna block the radar beam. If the angle
subtended at the antenna is more than a few
degrees, a non-detecting sector may be
produced. Within this sector targets can not be
detected.
Radar
antenna
Radar
mast
Shadow sector
Figure 2-5 Shadow sectors
2.3 SART (Search and Rescue
Transponder)
Note: The SART information below is excerpted
from IMO SN/Circ 197 Operation of Marine
Radar for SART Detection.
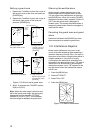
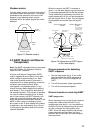
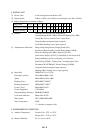
A Search and Rescue Transponder (SART)
may be triggered by any X-Band (3 cm) radar
within a range of approximately 8 nm. Each
radar pulse received causes it to transmit a
response which is swept repetitively across the
complete radar frequency band. When
interrogated, it first sweeps rapidly (0.4 µs)
through the band before beginning a relatively
slow sweep (7.5 µs) through the band back to
the starting frequency. This process is repeated
for a total of twelve complete cycles. At some
point in each sweep, the SART frequency will
match that of the interrogating radar and be
within the pass band of the radar receiver. If the
SART is within range, the frequency match
during each of the 12 slow sweeps will produce
a response on the radar display, thus a line of
12 dots equally spaced by about 0.64 nautical
miles will be shown.
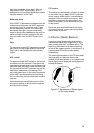
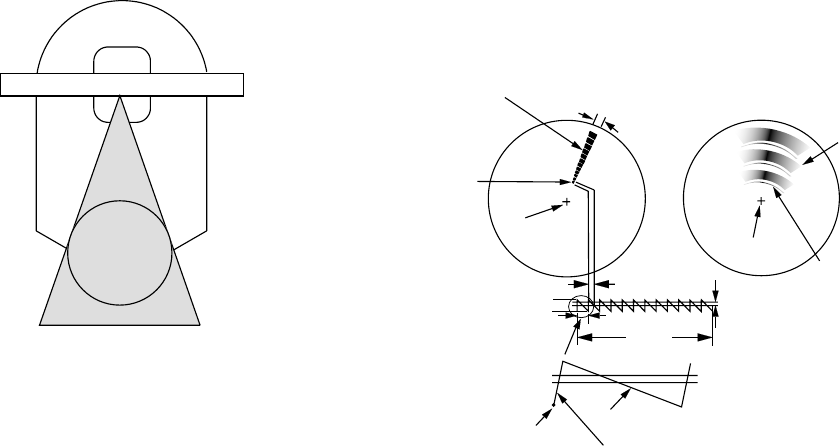
When the range to the SART is reduced to
about 1 nm, the radar display may show also the
12 responses generated during the fast sweeps.
These additional dot responses, which also are
equally spaced by 0.64 nm, will be interspersed
with the original line of 12 dots. They will appear
slightly weaker and smaller than the original
dots.
9500 MHz
9200 MHz
Radar antenna
beamwidth
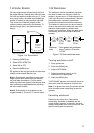
Screen A: When SART
is distant
Screen B: When SART
is close
Lines of 12 dots
are displayed in
concentric arcs.
Echo of SART
Position of
SART
Own ship's
position
Own ship's
position
SART mark
length
Radar receiver
bandwidth
Sweep time
7.5 µs
95 µs
Sweep start
High speed sweep signal
Low speed sweep signal
24 NM
1.5 NM
Position of
SART
Echo of
SART
Figure 2-6 Appearance of SART signal
on the radar display
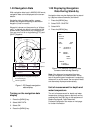
General procedure for detecting
SART response
1. Use the range scale of 6 or 12 nm as the
spacing between the SART responses is
about 0.6 nm (1125 m) to distinguish the
SART.
2. Turn off the automatic clutter suppression.
3. Turn off the Interference Rejector.
General remarks on receiving SART
SART range errors
When responses from only the 12 low frequency
sweeps are visible (when the SART is at a
range greater than about 1 nm), the position at
which the first dot is displayed may be as much
as 0.64 nm beyond the true position of the
SART. When the range closes so that the fast
sweep responses are seen also, the first of
these will be no more than 150 meters beyond
the true position.