


40
Operating Instructions
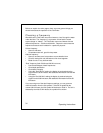
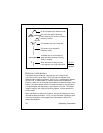
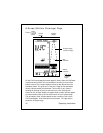
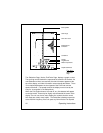
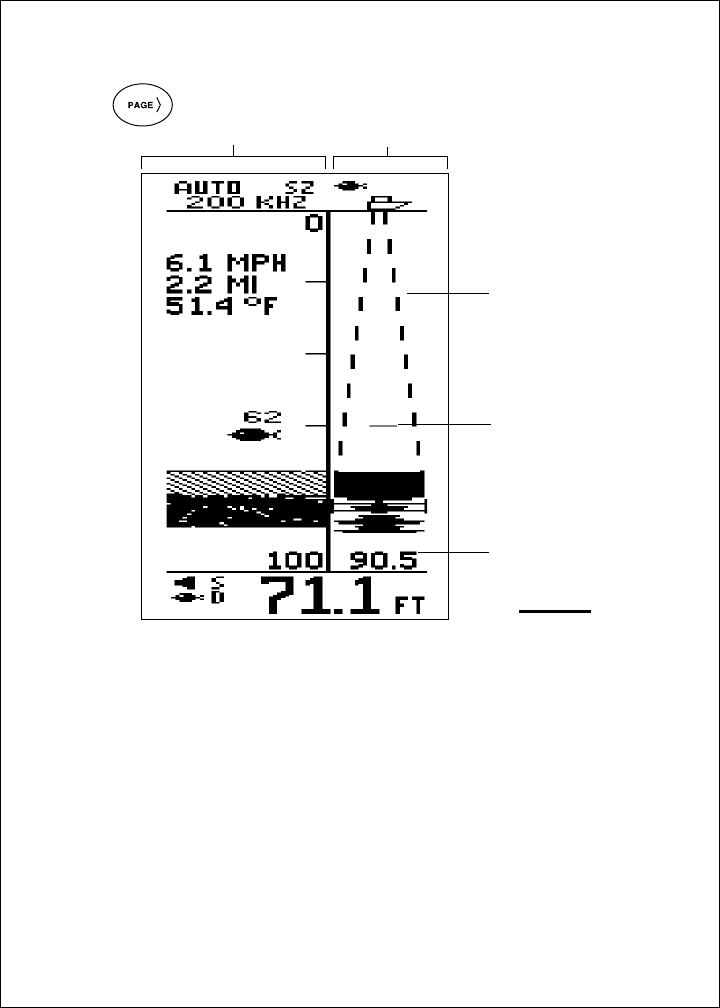
A-Scope image
(real time image)
Fish
indication
A-Scope
display
Normal
display
Bottom
coverage
Fig. 3-8
A-Scope
Page
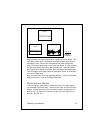
A-Scope (Bottom Coverage) Page
On the FishFinder display the bottom graph is “drawn” after the FishFinder
receives several echoes. This has the effect of showing a record of the
bottom contour. The A-scope displays raw sonar data directly from the
transducer beam. This gives you a “real time” image of fish and bottom
structure directly below the transducer. This function is very useful in
showing the strength of the echo returned from a fish. Stronger fish
echoes on the A-scope display will appear wider; weaker echoes appear
as narrow bands closer to the horizontal center of the A-scope image.
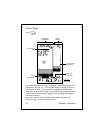
The left section of the A-Scope display shows a section of the normal
FishFinder display. All of the features are the same. The right section
shows the A-Scope image.
Press