


30
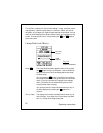
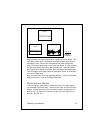
Some of these echoes indicate fish, and others show the bottom. As new
echoes are received, the FishFinder “draws” a graph of the bottom. The
bottom graph helps you to tell whether the bottom is rising or falling. It
also allows you to identify the shape or “structure” of the bottom. This
can indicate a reef or shipwreck.
Notice that the scrolling speed of the display does not necessarily match
the speed of the boat. The scrolling speed of the display is called the
“chart speed.” You can adjust this using the “System Setup Menu.” (See
Section 4.)
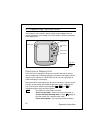
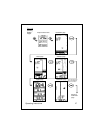
Many of the items on this display appear in the other modes. Since you are
likely to use the FishFinder page most often, we will explain all of these
items here.
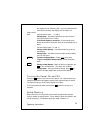
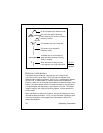
Top of display
Auto features on
(AUTO) If
any
of the automatic features are turned on, the “Auto”
indication will appear here. (These include the automatic
range, auto sensitivity, and auto zoom features.)
Auto range on (R)
The “range” is the maximum depth the unit is set to
measure. When the auto range feature is on, the
FishFinder chooses the correct range setting automatically.
Transducer frequency
The transducer can use two frequencies - 50 kHz for wide
coverage, or 200 kHz for a detailed view. You can also set
the unit to use both frequencies at the same time (“dual
frequency”). (For more on this, see “Choosing the Fre-
quency.”)
Auto sensitivity on (S)
The “sensitivity” controls the ability of the unit to tell the
difference between echoes of different strengths. A higher
sensitivity setting makes it easier to see smaller fish, but
also may pick up background noise. When auto sensitivity
is on, the FishFinder chooses the correct sensitivity setting
automatically.
Operating Instructions